As we turn onto the European Championships in Split this weekend, it’s still safe to say that the 2022 World Championships are a vivid memory in the minds of water polo fans worldwide. If we just look at the finals, the penalty shootout between Italy and Spain on the men’s side, or the last gasp chance for a Hungarian equaliser on the women’s side both stand testament to the quality of the competition in the hunt for the world championship medals.
We and other platforms have covered the results and have extensively provided the expert opinions of players, coaches and officials. Something crucial, however, has been greatly missed from these chronicles. Data. This article endeavours to fill that void through a collaboration with teamio.ai, a data analytics tool specialised in our beloved sport.
Some basic stats such as: the number of shots on target, blocks and steals, goalkeeper efficiency, and powerplay conversion rates are regular features of most water polo analyses. Nevertheless, when we glance over the fence to other sports (perhaps with larger budgets) we see endless lists of stats describing team and individual performance. For example, just take a look at this page of NBA stats.
Did someone say Moneyball? Yes, data-driven coaching has been part of other major sports for decades, but throughout the years it has eluded water polo. The team at teamio.ai aims to raise the bar, and make the utility of data a vital weapon in every coach’s arsenal. And no one is more knowledgeable in the use of data to improve performance than one of the three co-founders, the Hungarian water polo legend Daniel Varga – an Olympic (2008) and World (2013) champion.
Dani joined forces in 2020 with Mihaly Torok, a world-class mathematician, and Tamas Varkonyi, a social psychologist and an alumni of the University of Cambridge, to develop a powerful data capturing and analysis tool. By now, they are working with several teams including the Hungarian Women’s national team. Head coach, Attila Biro has said that their work “contributed significantly” to their excellent performance at the World Championship this summer.
Enough of the chit-chat though, let’s unleash the graphs of the Men’s World Championships Final of 2022 and see the top 5 conclusions through the lens of data analytics.
Just to recap here is what the game looked like at the final whistle, before the penalty shootout.
#1: True Shooting
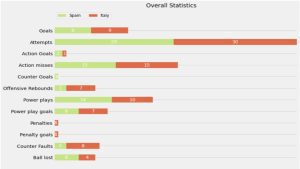
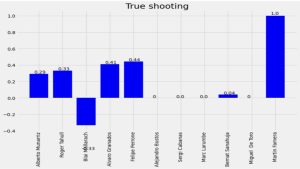
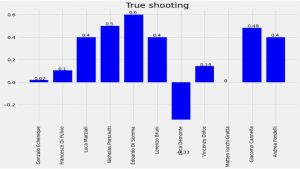
True shooting is a metric most basketball lovers will already be familiar with. It is a metric to describe how well a team has converted its opportunities of different difficulties into goals. If a team scores each situation (6v6, powerplay, counter, penalty) with its expected likelihood, then their true shooting will be around 0.3. Deviation from this can show performance compared to this average. In this case, both teams have slightly underperformed to an average game, but the Spaniards managed to stay a touch closer and score from slightly more difficult scenarios (one more action and counter goal vs a penalty and a powerplay goal on the other side).
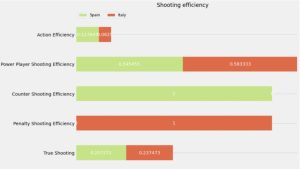
It is also worth mentioning that the power play efficiency on both sides was relatively high, close to the best performances we saw in the elimination rounds. However, action play efficiency could have been higher (around 0.20) on both sides but especially for Italy.
#2: 6-on-6 defence
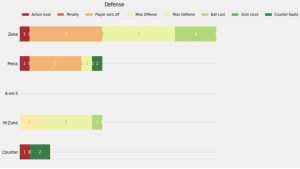
Up next is the efficiency of different forms of defence by both sides. A couple of things jump out:
- Zone defence was the most popular form of defence for both teams.
- The Spanish Zone defence performed particularly well. 16 positive outcomes vs 3 negative. The Italian zone defence could match this performance. 11 positive and 8 negative outcomes.
- Press performed quite badly on both sides.
- M-zone was highly effective for both teams, nevertheless it wasn’t played often.
- The Spaniards suffered more exclusions during swimming back and counter fauls.
Quick note: when a defensive strategy changes during a single defence (eg. from press to zone) teamio.ai codes the one prevailing in the moment of the shot.
Spain
Italy

#3: Power play tactics
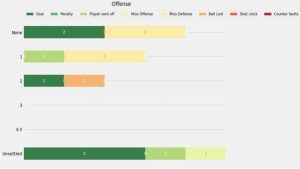
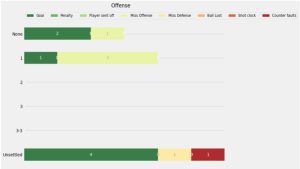
Before we move onto individual stats, we should briefly glance at the power play tactics of choice by both sides. Looking at all the power play attacks, we can see that Spain converted them with 43% efficiency, compared with Italy’s 70%. This is a significant difference that definitely gave Italy an edge during standard game time. This is not to be confused with Power Play Shooting Efficiency which compares the number of power play goals with the number of power play attempts (i.e. there can be more than one shot in a power play).
Let’s dig further though. Spain’s most popular choice was to finish the power play in what teamio.ai classifies as unsettled. This is a group that contains double man ups, quick shots against an unsettled defence, shot from an offensive rebound etc. They performed very well in this category scoring from 3 out of 5 (60%). The Spaniards opted for the standard 4-2 formation on four occasions (50% efficiency), went for a play 1 and 2 (left wing moves back, right wing moves back respectively) three times (0%) and twice (50%).
On the Italian side, we see a similar picture with unsettled performing the best (67%). Many of these situations were second attempts after a first failed but offensive rebound. Italy also scored two from 4-2 (“None”) formation and one from play 1.
Spain
Italy
#4: Individual performance
This is, in many respects, where the cookie crumbles, so let’s unpack the details. However, just before we dive in, it is important to emphasise that the below is reflective of a single game rather than overall player performance. To remove performance extremities and give a true picture of individual performance data from several games have to be analysed.
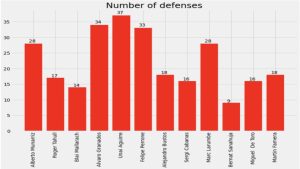
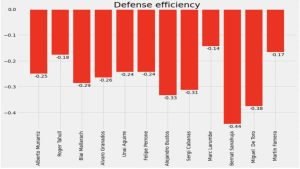
First off, defensive effectiveness should be analysed. What we can see here is that Marc Larumbe (0.14) led the Spanish defensive effectiveness before Martin Famera (0.17) and Roger Tahull (0.18). Larumbe’s score of 0.14 means that Italy scored from roughly every 7th attack when he was in the water, compared to, for example, almost every 2nd attack with Bernat Sanahuja. We can also see that Spain wasn’t the most cohesive in defensive performance with a relatively high variance in defensive effectiveness amongst different members of the team from the team’s non-weighted average of 0.24.
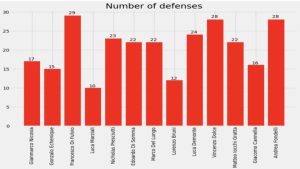
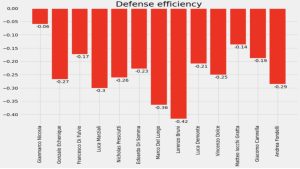
On the Italian side, the second golie Gianmarco Nicosia gave an absolutely stunning performance in defence with a score of 0.06 which shows that Spain needed 17 attacks to score a goal when he was guarding the net and organising the Italian defence. The honourable mention goes to Matteo Gratta and Francesco Di Fulvio with 0.14 and 0.17 respectively. We see a similarly high variance in the performance amongst the Italians with the team’s non-weighted average of 0.21.
Spain
Italy
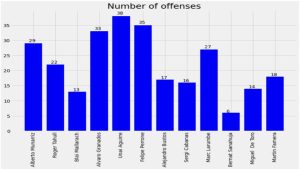
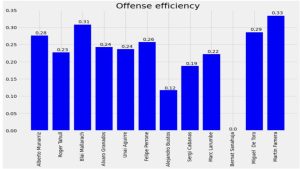
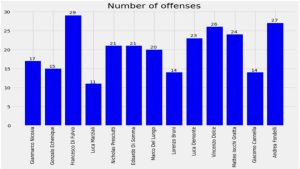
We find similarly interesting things when looking at the offensive stats. On the Spanish side the most effective attackers were Martin Famera and Blai Mallarach, with a score of 0.33 and 0.31 which means that when they were in the water, Spain scored roughly every 3rd attack. It is important to mention here that this does not necessarily mean that they were the ones who scored. Their time in the pool correlates the highest with the chance of scoring in this one game. Regarding the team averages, it was 0.24 for both Spain and Italy in this game.
With his 6 scored goals (out of this 2 penalties after the standard time), Alvaro Granados is of course worth a quick note here as he demonstrates the limitation of this metric quite well. When a player essentially plays the whole game these effectiveness measures fail to differentiate between their and the overall team performance as we can reliably analyse a time when they weren’t in the pool.
From the Italian band of brothers, Giacomo Cannella towers over his team mates in offensive effectiveness (0.57) followed by Luca Marzali (0.36).
Spain
Italy

Staying on offence for a tiny bit longer, individual true shooting scores from this game are also incredibly interesting. On the Spanish side after Martin Famera who scored 1/1, we see Felipe Perrone (0.44) and Alvaro Granados (0.41) well above the theoretical average score of 0.3. A testament to the Spanish defence reveals itself when we look at the same metric for Italy. Here, we see 6 players above the true shooting score of 0.4. This is a rather exceptional achievement!
Spain
Italy
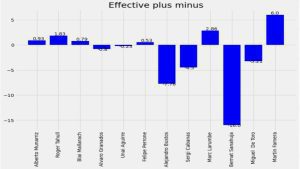
Glancing over the overall effective +/- numbers on the Spanish side, we can conclude that Martin Famera (6.0) and Marc Larumbe (2.86) gave the best overall performance in this game. Their score means that if they had played the whole game with the performance they gave during the time they were actually in the water, Spain would have won by 6 and 3 goals respectively.
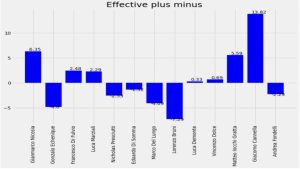
For Mr Campagna’s Italy, the player with the highest effective +/- score was Giacomo Cannella, who outperformed the team average by a whopping 11 goals. Matteo Iocchi Gratta and the second goalie, Gianmarco Nicosia also had a great overall game.
Spain
Italy
#5: Player pairs
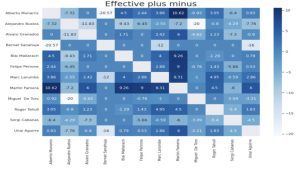
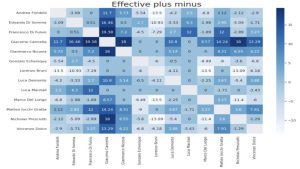
Finally, we conclude our analysis with the fireworks, and turn our attention to the effective +/- for player pairs. This metric shows how well 2 players performed together in this particular game.
For Spain, the best performing pairs were Martin Famera with Alberto Munarriz (10.62), Martin Famera with Blai Mallarach (9.26) and Martin Famera with Felipe Perrone (9). These numbers carry the same meaning as for individuals.
Meanwhile for Italy, there were a few fantastic duos most starring Giacomo Cannella and his Pro Recco team mates. Just to mention the best combinations: Giacomo Cannella with Francesco Di Fulvio (19.38!) and with Nicholas Presciutti (18).
Spain
Italy
The aforementioned stats, beyond giving an insight into the men’s final, chiefly show the direction which our sport is headed into. Soon graphs like this can potentially be used to increase the popularity of our sport, similarly in the ways statistics gained interest in basketball, baseball or football.
Daniel Varga added: “The next big milestone for temio.ai, is to link video analysis to the powerful stats we already have. Coaches will soon be able to watch all successful blocks of player A, or all missed shots between 4 and 6 metres of distance from the goal without any human input straight after the games. Imagine the effect this will have on the sport. We can’t wait!”


